
Human intelligence for AI engineering
Measure the human side of AI engineering.
AI tools show what the agents did. Ascenda shows how the engineers directing them are working, and whether that pace holds up.
- Steering
- Decision load
- Focus and fragmentation
- Interruptions
- After-hours
Works with Claude Code · Codex · Cursor · Gemini CLI
- Counts, not content
- No source code leaves your Mac
- No individual view
A sample 90-day Study report. Figures are illustrative only.
The missing layer
AI tools measure the machine. Ascenda measures the human driving it.
Your AI telemetry is good at what the agents did. It says almost nothing about the engineer steering them: how much attention it took, how often they were pulled back in, what it did to their day.
| Your AI telemetry tells you | Ascenda tells you |
|---|---|
| Agent activity | How much steering it needed |
| Tokens and usage | Decision load: prompts, approvals, corrections |
| Sessions | Focus blocks and fragmentation |
| Output | The supervising, checking and rework behind it |
| Adoption numbers | How engineers are actually adapting |
Nothing new to instrument. Ascenda reads what your AI tools already log, on the engineer’s machine, and adds a ten-second check-in for the part no log can see.
The shift
Less writing code. More directing, checking and deciding.
AI made engineers faster. But somewhere along the way the job changed shape. More of the day now goes on supervising: running several agents at once, reading code you didn’t write, holding the context they keep dropping.
You’re still in the loop. The loop just looks different now. AI didn’t remove pressure. It changed where pressure lives.
Directing
Framing the task, picking the context, deciding what the agent is and isn't allowed to touch.
Dispatch. 7 sessions sent subagents
Checking
Reading output you didn't write, as fast as it arrives, and deciding whether you trust it.
Holding. Sessions waited on you more than usual on 3 days
Deciding
Approve, correct, re-prompt, abandon. A steady stream of small judgement calls, often across several sessions at once.
Vectoring. 612 prompts across the week
Glyphs drawn from example counts.
Two signal classes
The relationship is the signal.
Flow reads how much the work asked from the tools you already use. What it can’t read, it asks you: how it felt. Telemetry can tell you the shape of a day. It can’t tell you whether that day left you sharp or flattened.
The work · read from your tools
What did the work demand?
Read from your AI tools’ own activity. Counts and timings, not content.
Steering: hands-on time versus time spent supervising agents
Work in flight: how many sessions and agents are running at once
Switching: moves between tools, projects and contexts
Session shape: focus blocks, long unbroken stretches, when the day ran
Interventions: permission prompts and stalls that pull you back in
Context and compaction: how full the agent's context ran, and how often it compacted
Rework: tool failures, re-prompts and retry storms
After-hours: how much of the work spilled past the working day
The human · you tell us
How did that demand land?
A ten-second check-in, in your words.
Pressure: strained or clear, and whether the work read as challenge or threat
Clarity: how clear the task and the next step felt
Activation: drained, or activated
Recovery: for engineers who pair the phone companion; never shared with an organisation
Same workload. Different landing.
Engineer A
Four agents in flight, heavy review, a long stretch. Reports clear, activated, read as challenge.
Engineer B
The same shape of day on paper. Reports strained, drained, read as threat.
On telemetry alone, that’s the same day twice. Add what each of them told us and it’s two different problems, with two different fixes.
The machine record
The machine already contains the record.
Every AI coding tool already keeps a log of the new job. Sessions, tool calls, retries, compactions, approvals. Most people never look at it. Flow reads it on your Mac and turns it into a picture of how your work actually ran.
And it doesn’t start from zero. Flow can import the weeks you’ve already worked, so the first read isn’t a blank page. From then on it runs live.
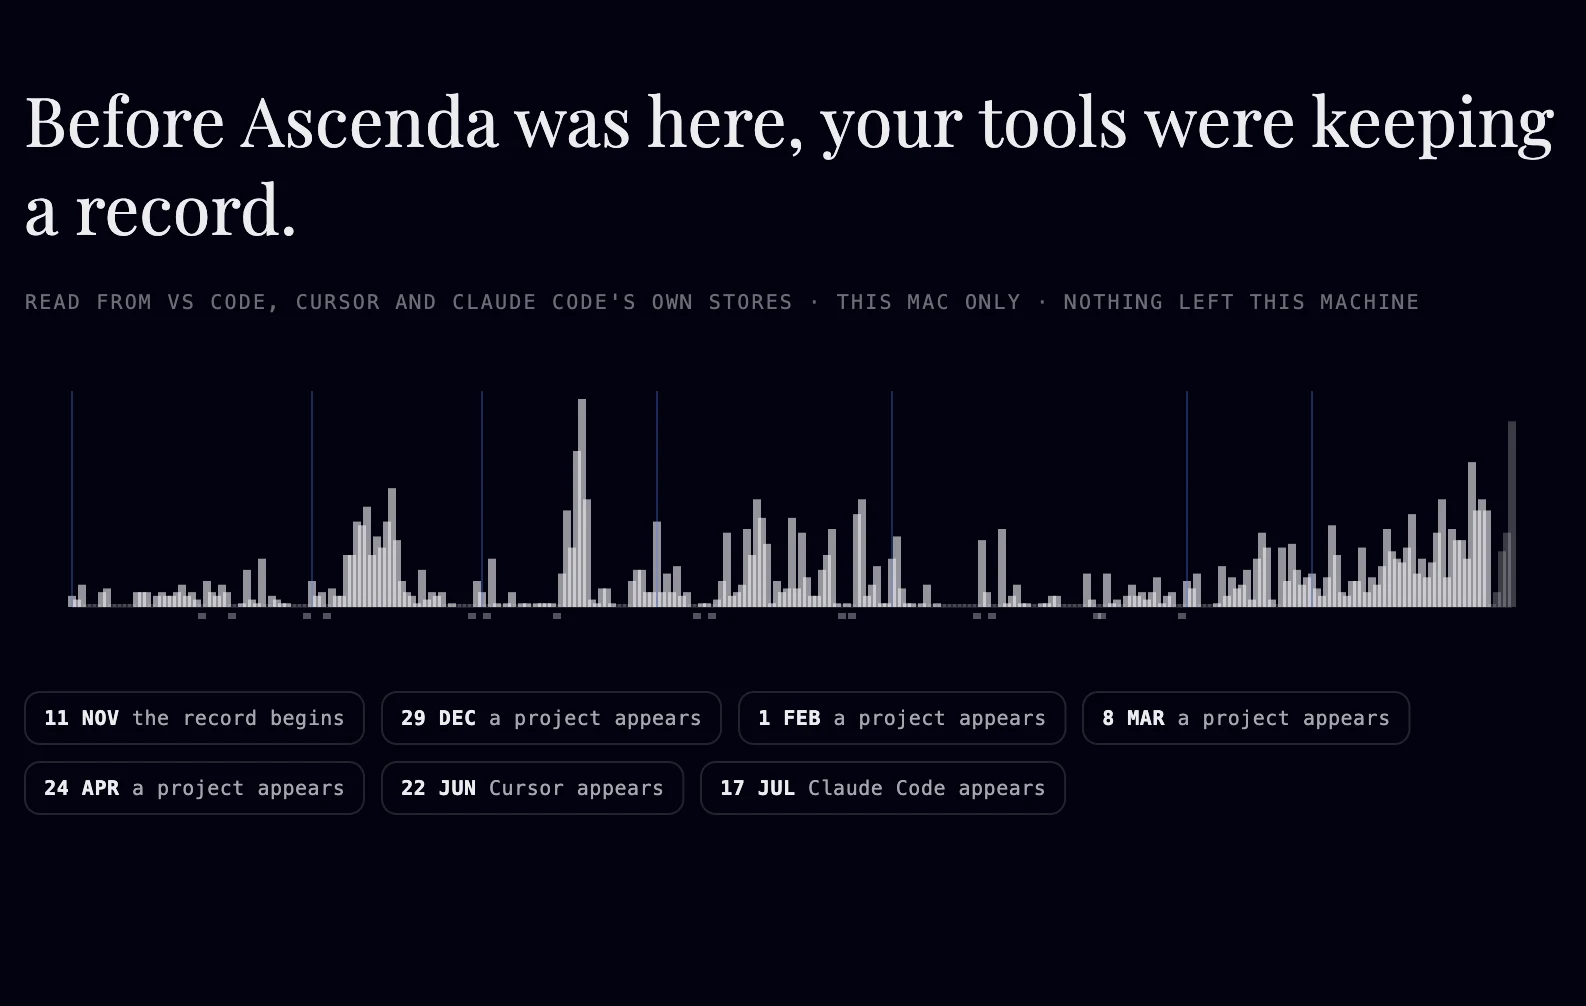
The Reveal, at the end of Flow’s history import: months of work your tools had already recorded.
Counts, not content.
Flow reads your AI tools’ local history and live activity on your Mac. What it sends is counts, timings and tool events, never your prompts, code or model outputs. Your journal and reflections stay on your Mac unless you turn on sync. Exactly what Flow reads and sends →
For engineering leaders
See how your engineering organisation is adapting to AI.
Aggregate team patterns, never below ten people and never an individual. Enough to see what is working, and to test what might work better.
Track
How AI is changing the shape of the work across your cohorts, over a 30-day Report or a 90-day Study.
Discover
Which working patterns go with lower supervisory load and steadier focus, in your own teams.
Improve
Declare a change, freeze the baseline, read the result. Engineers get their own weekly read-back.
BenchmarkBuilding
Comparison against other AI-native teams. Talk to us.
The feedback loop
See it. Change it. Measure what worked.
Ascenda is built around one loop: change one thing and find out whether it helped, for one engineer or a whole team.
For the engineer
- See it
Flow reads your week back to you: how the work ran, and how you said it landed.
- Change it
You choose one thing to change, and the measure it should move.
- Measure what worked
It comes back on a set day. Flow shows what the record did next, beside your own verdict, and keeps the two separate.
For the organisation
- See it
See aggregate human × agent working patterns across a cohort of ten or more.
- Change it
Declare a change before you make it: what changes, the measure, the baseline and the window. The baseline freezes.
- Measure what worked
The readout is reported whichever way it goes. Keep it, change it or stop it on the evidence.
What a readout looks like
Before
Sessions running · a representative day, weeks 1 to 9
9 at once. One line per session in flight at the busiest quarter-hour.
After
Sessions running · a representative day, weeks 10 to 12
4 at once. One line per session in flight at the busiest quarter-hour.
The readout
- Next-day tool failures per active hour
- 1.9→1.1
- Next-day tool failures per active hour
- Declared measure
- Active hours per engineer: the same amount of work
- 13.9→13.6
- Active hours per engineer: the same amount of work
- Sessions running at the peak
- 9→4
- Sessions running at the peak
Fewer agents at once, the same hours, and less rework the next day. The measure moved in the direction the cohort declared.
The Ascenda system
Work → Human → Change → Readout.
Each time round the loop leaves a record of four things: how the work ran, how it landed, what you changed, and what happened next. Stack enough of those up and you start to see which ways of working hold up, for the work and for the people doing it.
WorkWhat actually happened?
The machine record of the human × agent loop.
HumanHow did it land?
What the engineer reported, in the moment.
ChangeWhat did the engineer or team alter?
One declared change, with its measure fixed in advance.
ReadoutWhat happened next?
To the work, and to what people told us.
Human-performance science
Software telemetry tells us what happened. Human-performance science helps us understand what it asked of the person.
Ascenda was started by a software-systems engineer and a psychologist. A team of only telemetry engineers would measure the system beautifully and the person badly.
Who builds Ascenda →Measurement
What a signal can and cannot tell you, and how to say so.
Work demand
Separating what the work asked from how the person met it.
Human state
Pressure, clarity, activation and recovery, as the person reports them.
Change
Designing a change so its result can be read honestly.
Sustainable performance
Sustainable performance is the outcome.
It comes from understanding the system people work in, changing one thing at a time, and keeping what holds up.
- Instrument human × agent work
- Understand the work and the human
- Test one change at a time
- Keep what works
Machine telemetry can tell you how the work ran. Human signals can tell you how it landed. Ascenda connects the two to learn what actually works.